

“If only I’d bought in XYZ 10 years ago…”.
Such is the refrain of many a would-be property investor who missed out on getting into a particular property market before it boomed.
At the present time it’s the Sydney and Melbourne markets that have surged ahead in recent years. In hindsight it may have seemed so obvious…
Hindsight is 20-20
“Hindsight is 20-20”, as they say, and there’s hardly a person alive who doesn’t have a story of an investment they didn’t make, that subsequently performed well.
That’s all very well – but it’s not useful to you as an investor who wants to translate the lessons of the past into better outcomes in the future.
So let me ask you a question…
What if you could know in advance which suburbs are likely to be the next winner’s in Australia’s property market? Here are 8 suburb data points that give you a rational basis for selecting high future growth suburbs.
Demand vs Supply Determines Price
As any introductory economics text book will tell you that price is a function of SUPPLY and DEMAND.
When demand outstrips supply, price goes up – and the same is true for property.

So, as a property investor, in order to buy into the next boom suburb, you need to locate suburbs where there are leading indicators of demand outstripping supply.
Here are 8 such indicators…
The 8 Data Points That Predict Suburb Growth Potential
Let’s look at 8 data points that give you a snapshot of what is happening to supply and demand in a given suburb.
These 8 numbers are the components of the DSR Score or Demand to Supply Ratio.
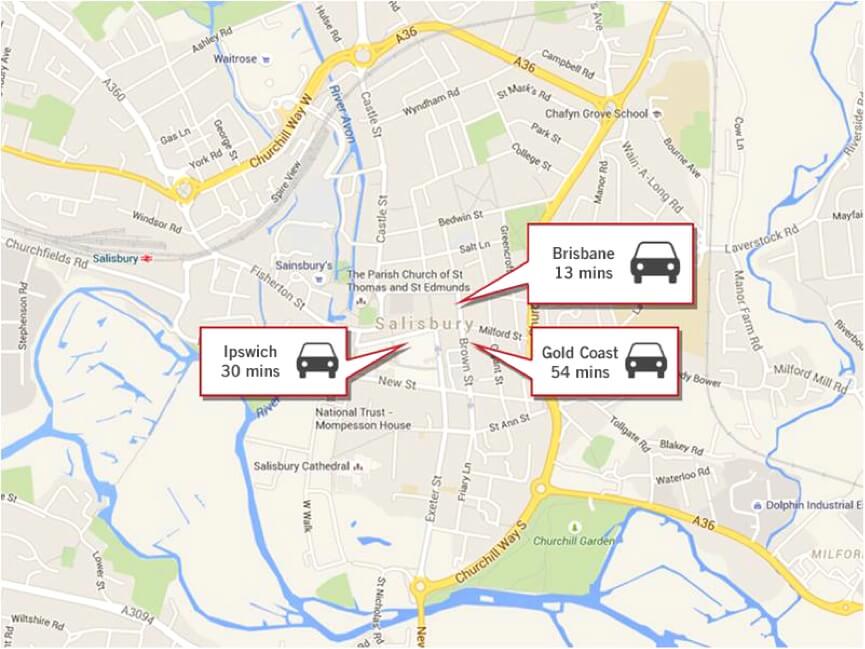
Let’s run though what these numbers are, using the up-and-coming suburb of Salisbury in South Brisbane, QLD as an example.
Smart Number #1: Typical Dwelling Value
The first number is Typical Dwelling Value. If average price is rising, especially in a steady trend, then that is evidence that demand is higher than supply.
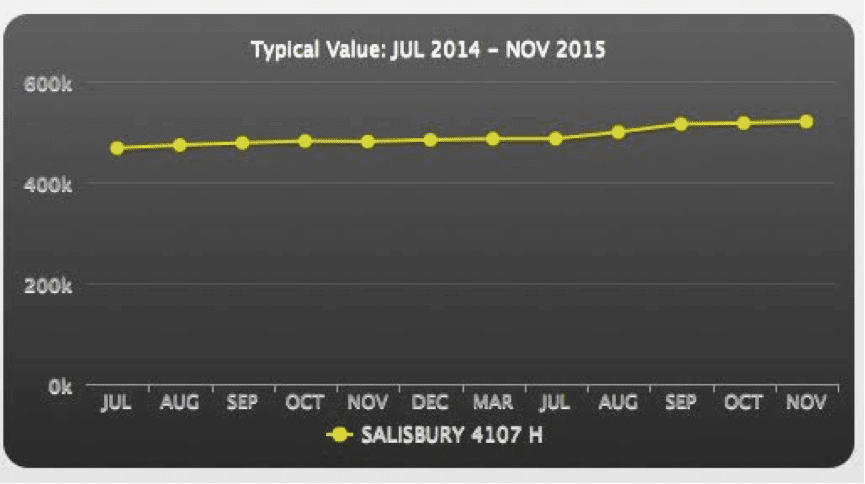
It takes bold (foolhardy?) timing to buy into a suburb where prices are falling, expecting prices to rise all of a sudden.
Smart Number #2: Days on Market
Days On Market is the number of days the average “for sale” property remains on the market. A low number of days indicates buyers are snapping up whatever is on the market quickly, whereas a high number of days means buyers are in no hurry and are biding their time and not particularly concerned about missing out.
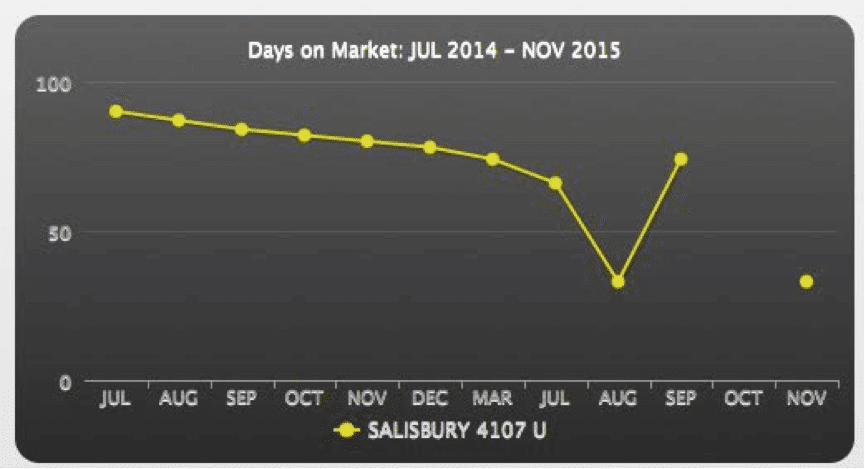
In the above image, we see a steadily falling number of days on market, indicating demand is gathering pace compared with supply. (Where data points are missing, that indicates there were insufficient data to get a reliable reading at the time).
Smart Number #3: Auction Clearance Rate
Auction Clearance Rates indicate the proportion of auctions that result in a successful sale.
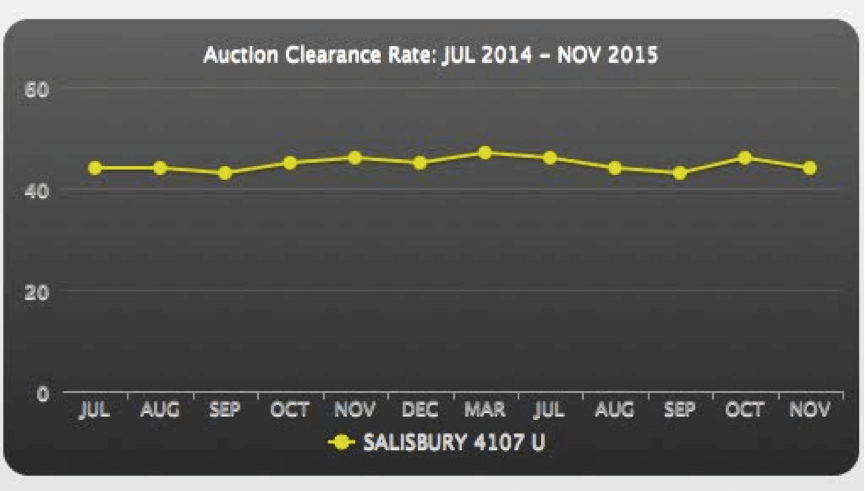
In a very hot market where demand greatly outstrips supply, we would expect a high clearance rate. In the above example we see a steady clearance rate in about the 45% range – indicating a healthy but not red-hot clearance of properties at auction.
Smart Number #4: Stock On Market
Stock On Market refers to the proportion of dwellings in the surburb that are listed for sale any particular time.
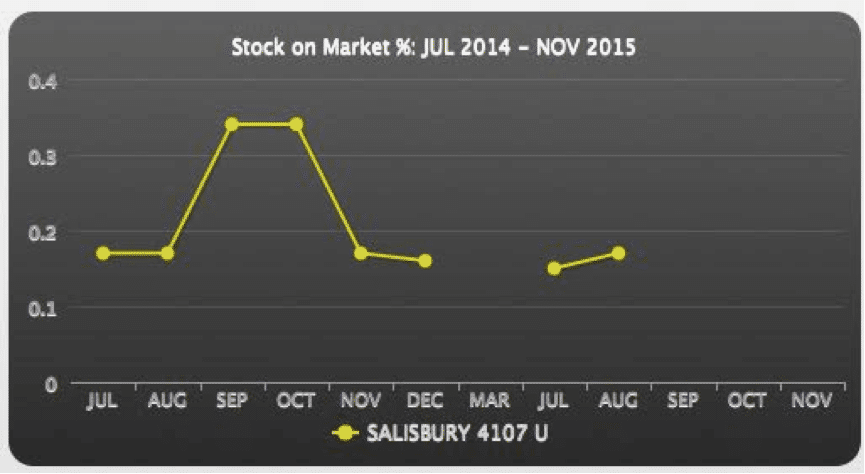
A low “Stock On Market” number indicates very little supply – which is bullish for price growth.
Smart Number #5: Proportion of Renters
Proportion of Renters refers to the ratio of rental residential properties to owner/occupied properties.
In general, as an investor it is more desirable to seek a suburb with a low proportion of renters.
Owner occupiers tend to look after their properties better than renters and invest more than would be commercially justified in the upkeep of their properties.
Suburbs with a low proportion of renters may also offer less supply of rental properties, thus increasing rents.
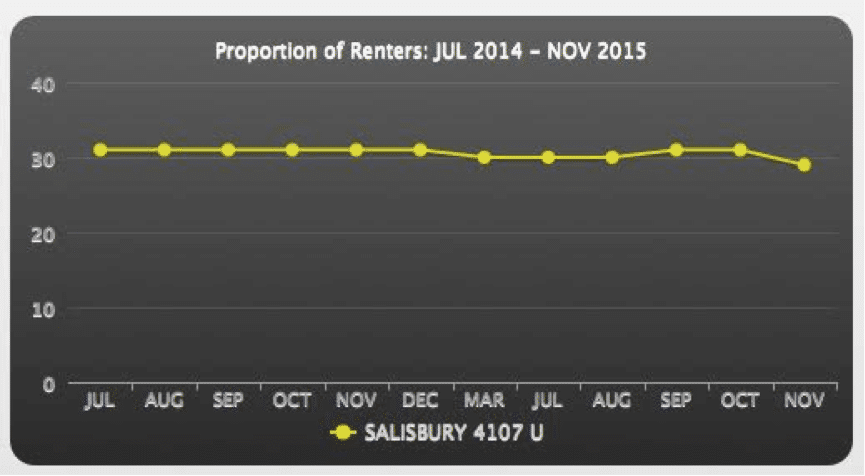
In the above graph we see a Proportion of Renters around ~30%, which is slightly higher than the national mean of ~25%.
A further item to investigate would be the nature of the properties being rented and whether certain property types (e.g. new properties) are more in-demand. This can be the case in a suburb with a lot of older stock and low supply of new dwellings, which are traditionally popular with tenants.
Smart Number #6: Rental Vacancy Rate
Rental Vacancy Rate is another signpost of supply vs demand.
A very low vacancy rate indicates that vacant properties are snapped up by tenants the moment they become available.
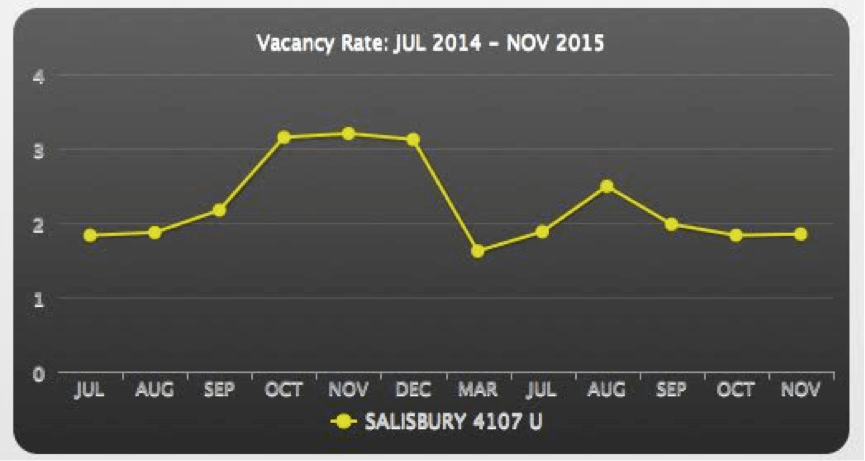
In the above example, we see a vacancy rate of ~2%, which suggests the average rental property is vacant around 1 week of the year – slightly less than the national average of 2.6%.
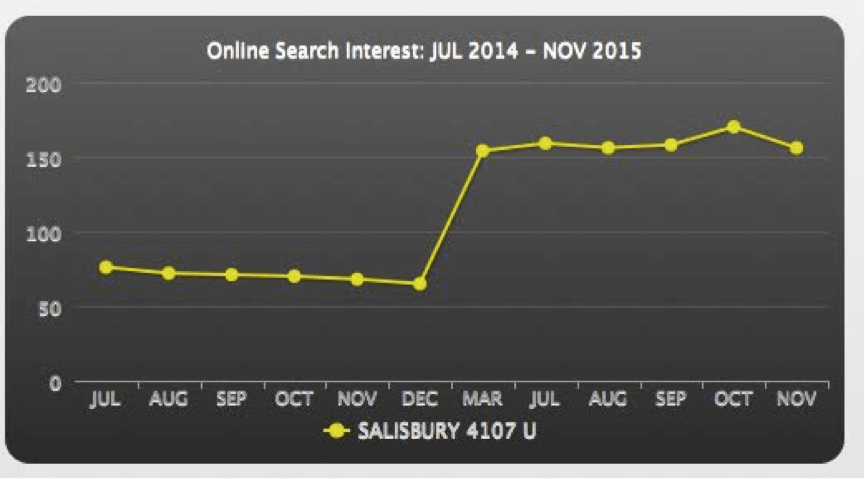
Smart Number #7: Online Search Interest
Online Search Interest is a measure of which suburbs other investors may be considering – on the principle that this is a leading indicator of future demand. Here we see a big leap in interest around March 2015.
Smart Number #8: Rental Yield
Rental Yield indicates the potential cash flow a property may deliver to investors. All things being equal, higher yield suburbs will be more attractive to investors than lower-yield suburbs.
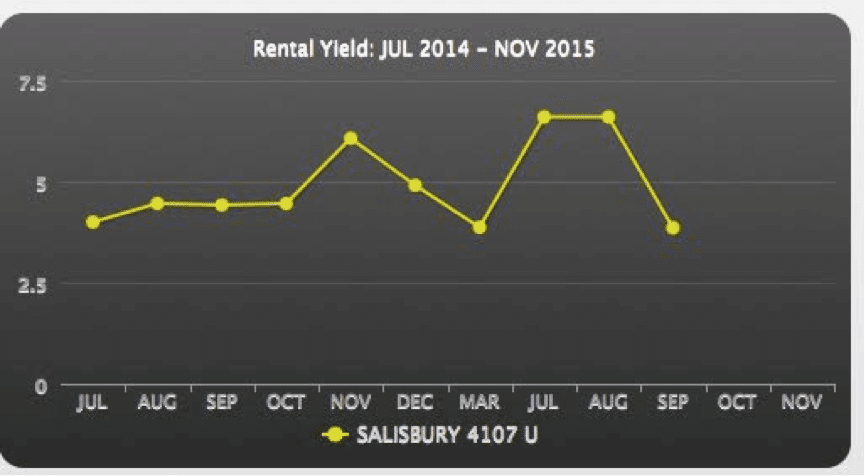
But yield – like all the data points – needs to be considered in the context of the property and the suburb being considered.
Some high-yield suburbs may have poor growth prospects. Occasionally it’s possible to find suburbs that deliver both strong growth potential and strong yield.
However, those suburbs don’t tend to last long – because savvy investors identify them and snap them up, driving up prices and bringing yields off the boil.
Conclusion
Now you see how data-driven investors are tapping into big data to make better suburb choices.
The best property in a dog of a suburb will go nowhere, but an average property in a great suburb can go through the roof.
For interested investors, Smart Property has published an Investor Report and webinar where these concepts are explored in more detail and applied to current property investment opportunities with a focus on growth and positive cash flow.

